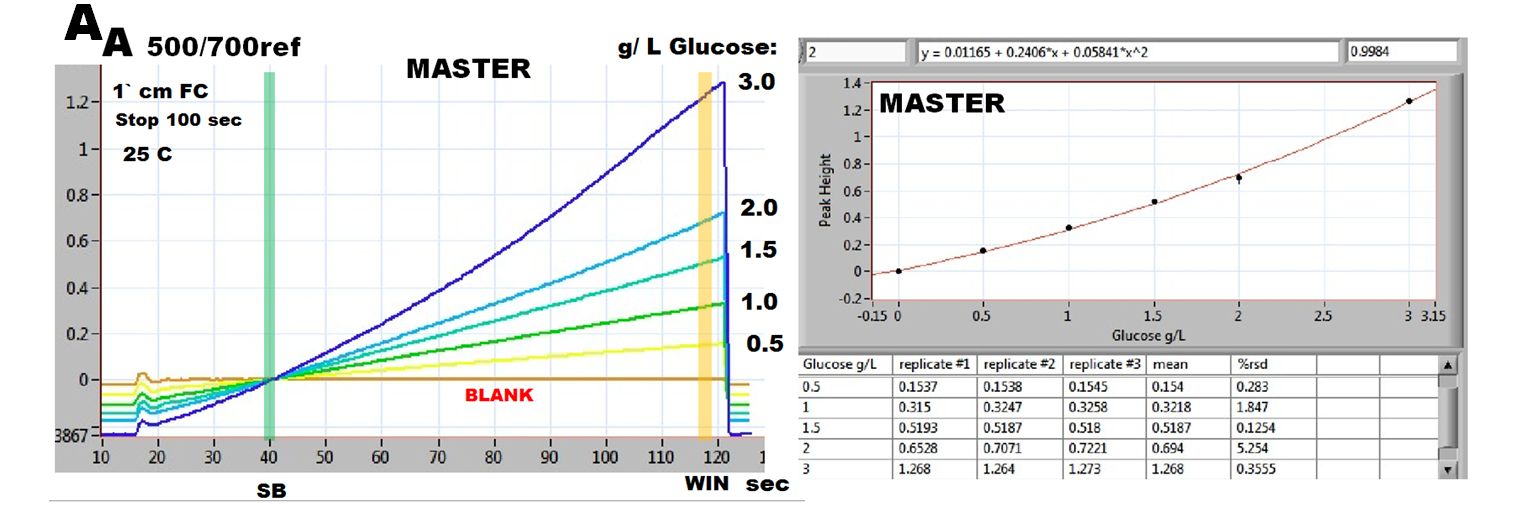
Parsing selected portion of a reaction rate curve into individual segments that represent series of virtual concentrations related to the most concentrated standard solution is the basis of SSRRC method. Similar to SSGC approach (2.2.38.B.) a MASTER calibration (A) is performed first, by subtracting baseline (SB green box) from the value close the end of stop flow period (WIN orange box), when analyzing serially diluted standard solutions by assay protocol (C) presented on the next page. The thus obtained calibration graph (A right) is used to obtain absorbancies and concentrations for construction of the SLAVE calibration curve.


Single Standard Reaction Rate Calibration
Glucose Assay
2.2.38.D.


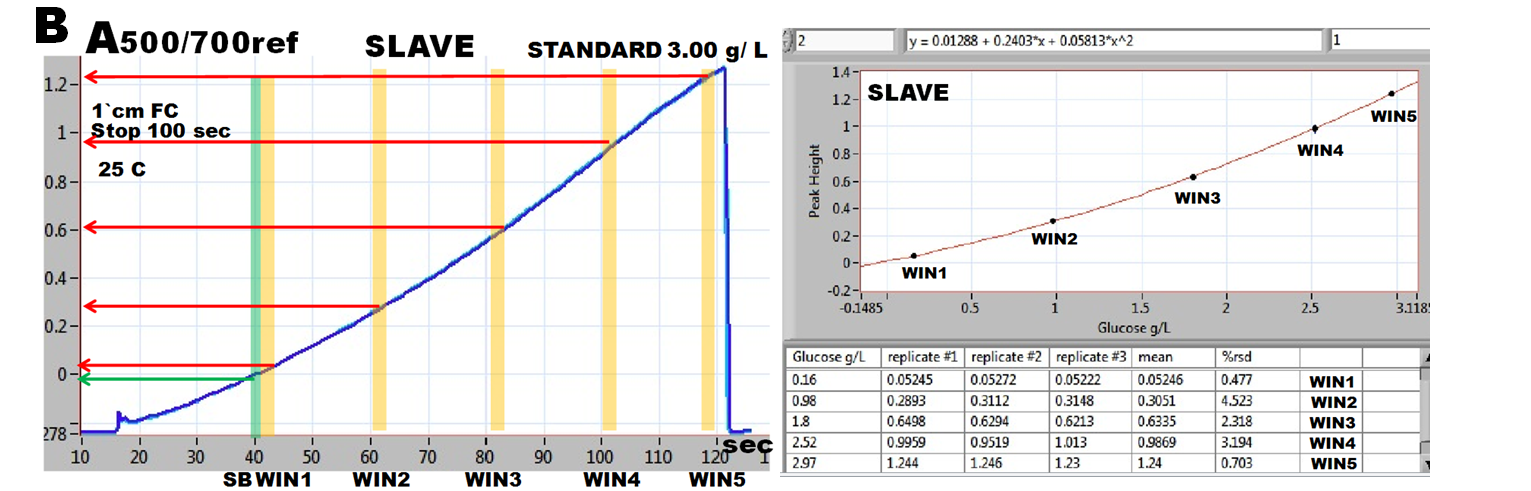
The data for SLAVE calibration are obtained by placing data harvesting windows along the reaction rate curve (B left) and by using MASTER calibration, curve while analyzing the most concentrated standard solution (see protocol D on the next page). This yields absorbance and virtual concentration values from windows WIN1 to WIN5 (orange boxes) used to populate the SLAVE calibration table (B right). Validity of SSRRC method was verified by Control experiments, by analyzing serially diluted standards using SLAVE calibration (next page).